The wildfire in 3D
Asociación Albiétar6 min read
An invitation to explore
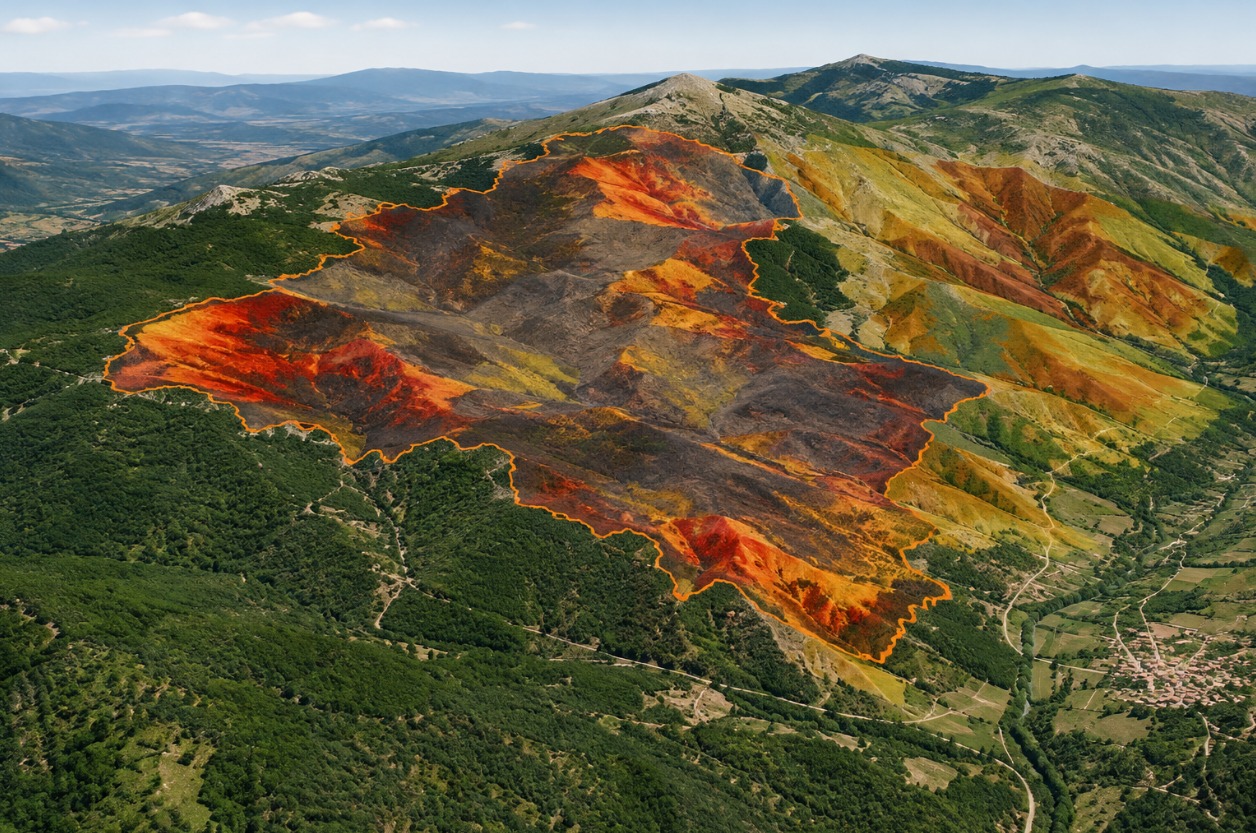
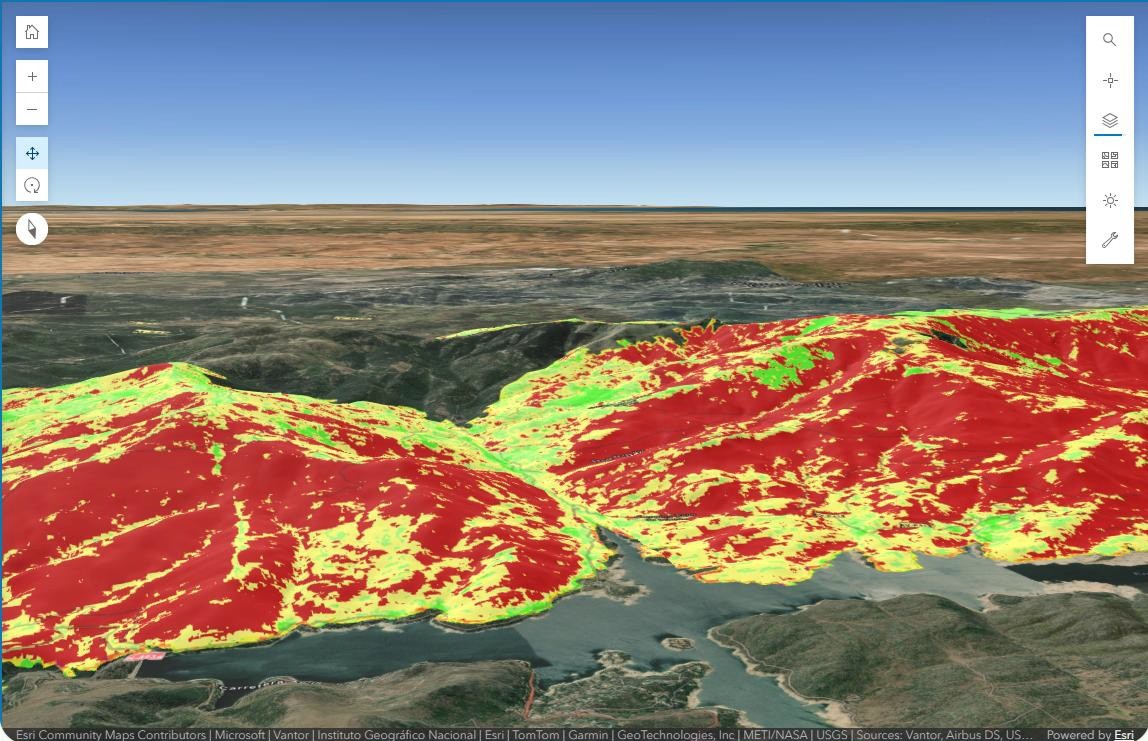
This map is more than just an image of the burnt area. It is an interactive tool for exploring the landscape, comparing information and understanding why each hillside, valley or settlement needs to be considered differently.
Open the interactive map
Explore the 3D viewer from ALBIETAR and follow this guide as you use it.
What can a map tell us after a wildfire?
An aerial photograph shows where the fire has spread, but does not always help us understand the terrain fully. To interpret what happened, we need to consider several questions together: how far did the fire spread? Which areas were most severely affected? What are the slopes like? Where might the risk of erosion increase when it rains?
The ALBIÉTAR viewer brings this information together for the same area and presents it in three dimensions. This lets us zoom in and out, change the viewpoint and switch on different layers to compare what is happening in each location.
ALBIÉTAR's commitment stems from a desire to support the landscape's recovery over the coming years, putting technology at the service of people and our woodlands. We will add new data, indicators and tools to help visualise the progress of recovery, learn about the work carried out and highlight the efforts of the volunteers, landowners, local councils and organisations involved. By combining GIS and Artificial Intelligence, we will be able to better understand what is happening on the ground, measure progress and support decisions that promote more effective and sustainable recovery. Because restoring a landscape after a major wildfire is not just about taking action today, but about creating a better-prepared, more resilient landscape for the future.
What is GIS?
A Geographic Information System, or GIS, is a tool that organises information linked to specific places and displays it on a map. Its value lies not just in plotting data, but in allowing us to compare them and understand how they relate to one another.
Think of it as a series of transparent sheets One sheet shows the terrain; another, the affected area; another, the observed burn severity; and another, the risk of erosion. Overlaying them gives us a fuller picture than looking at each one separately.
GIS helps organise and share information, identify areas that need more attention and support planning. It does not replace field visits or the judgement of forestry and environmental specialists, but it helps the public, technical experts and public authorities discuss the same geographical area using a shared reference.
The viewer's four key layers
As you explore the map, you will find several layers. Each answers a different question:
1. Fire perimeter
How far did the fire spread? This outlines the geographical extent of the fire and shows its location in relation to municipalities, tracks, mountains and valleys. Being within the perimeter does not mean that the whole area suffered the same level of damage.
2. Burn severity
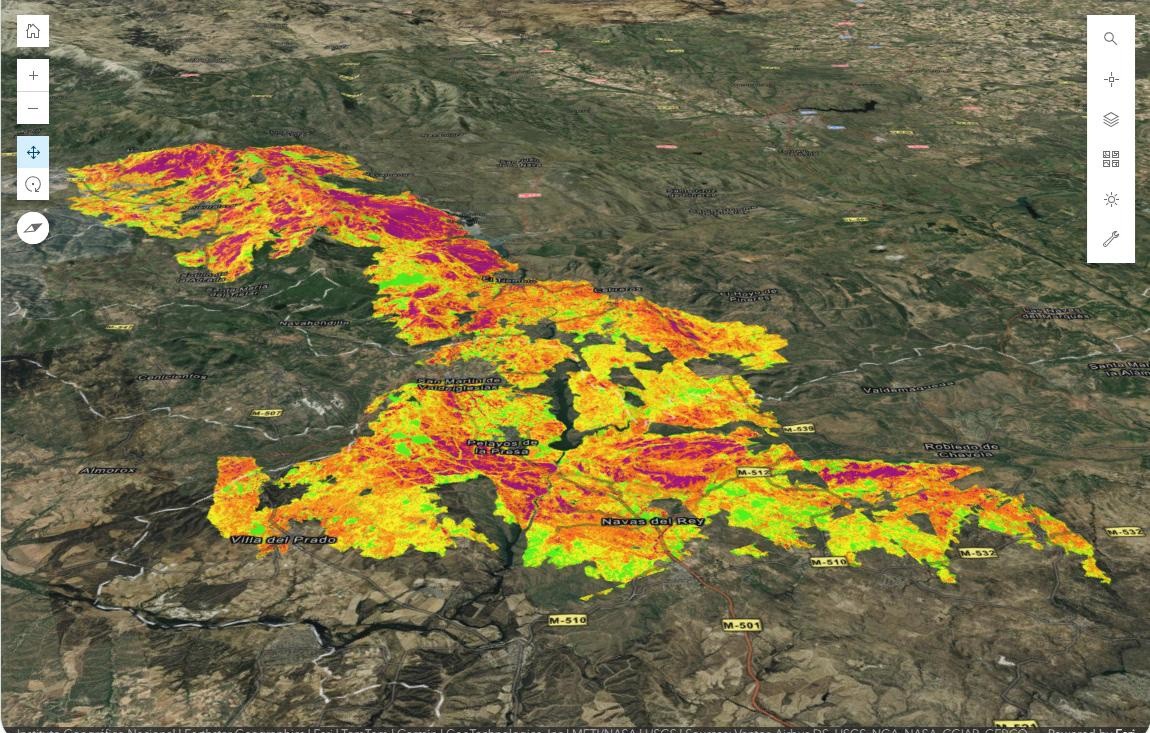
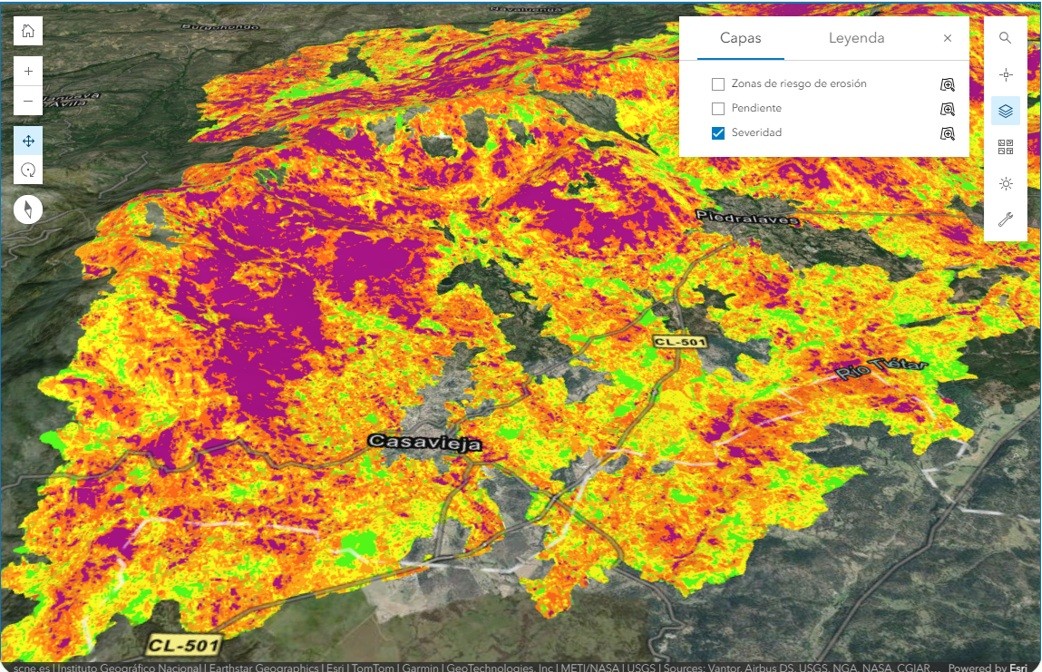
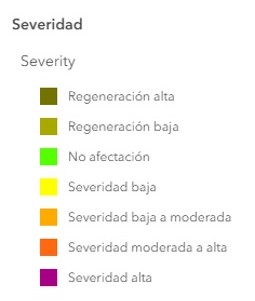
How do the effects of the fire vary? The burn severity layer represents differences in the observed effects on vegetation and soil. The colours help show that the impact was not uniform. The legend is essential: it explains what each colour means and prevents misinterpretation.
3. Terrain
What are the mountains, hillsides and valleys like? The 3D representation lets you identify high and low areas, ridges, hollows and slopes. The terrain helps explain accessibility, the flow of water and why two nearby places may need different interventions.
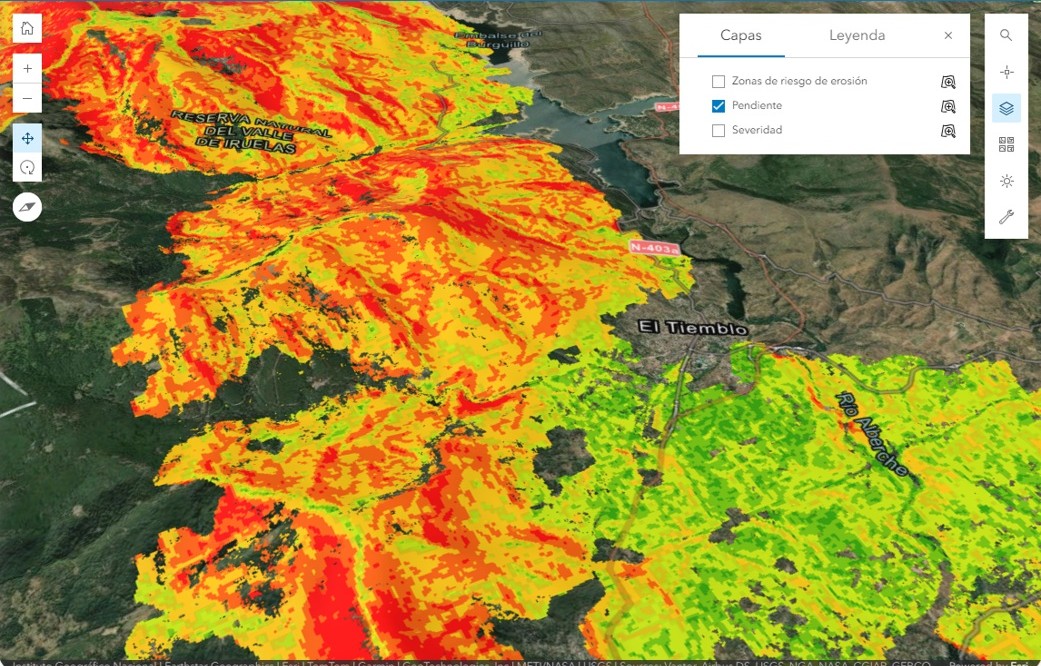
The terrain provides context for interpreting the other layers.
4. Erosion risk
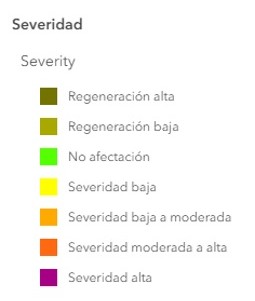
Which areas may be more vulnerable when it rains? After a wildfire, the loss of vegetation can leave the soil more exposed. Rain can wash soil and organic matter downhill. This layer indicates relative risk levels to guide observation and analysis, but does not in itself demonstrate that erosion has already occurred.
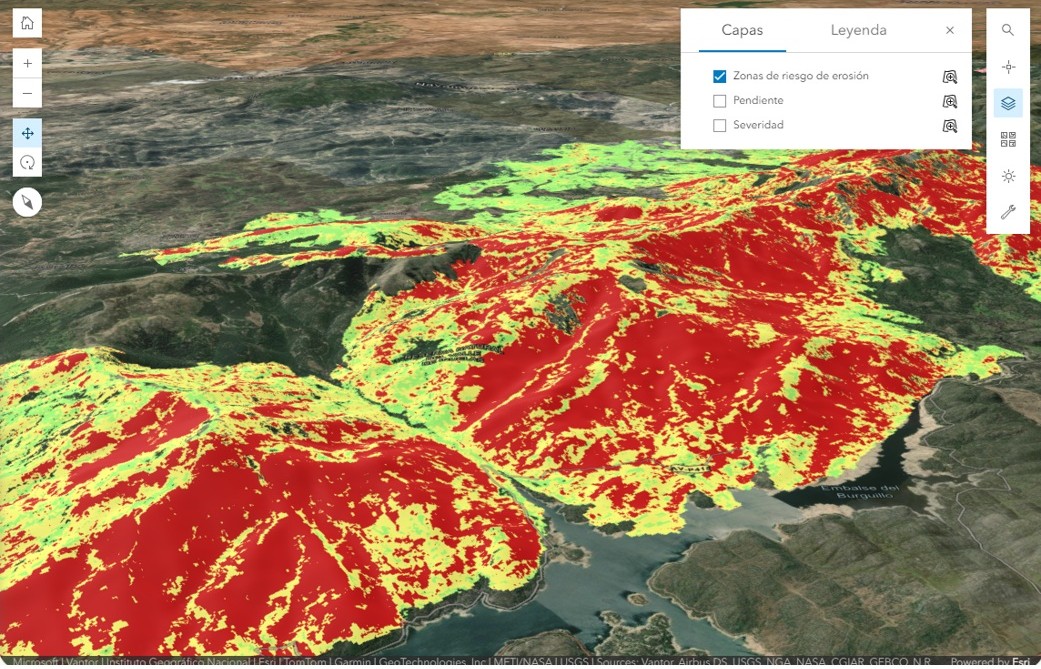
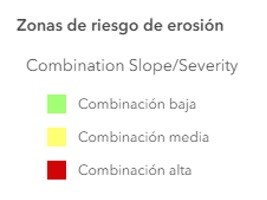
Legend for the combination used to represent erosion risk.
How to use the map step by step
You do not need any knowledge of cartography. Start with an area you know and spend a few minutes trying out the controls.
1. Open the viewer
Access the map from the ALBIETAR website, Open ALBIETAR's interactive 3D map
2. Move around the landscape
Zoom in and out and rotate the scene. Switch between an overhead view and a tilted view to identify slopes and valleys more clearly.
3. Change the basemap
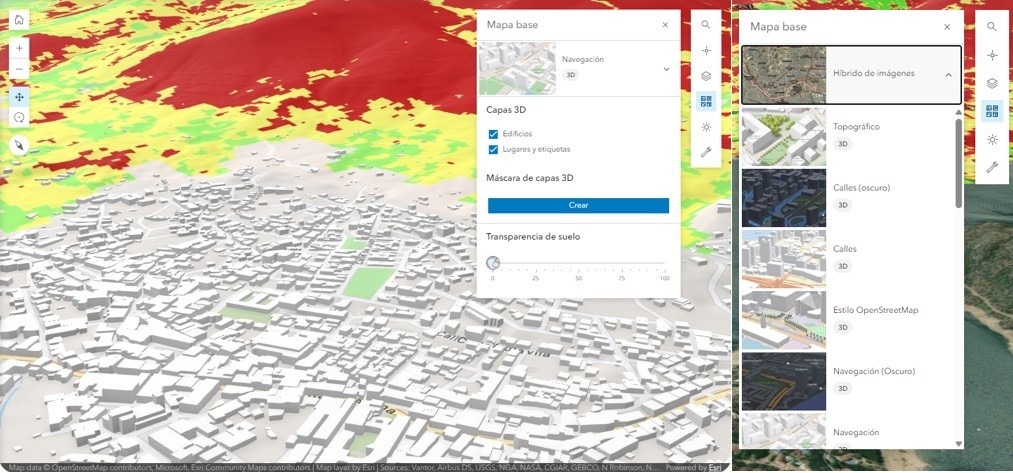
Try the available options. An imagery background helps you recognise the landscape; a street map can make it easier to find your bearings. The background changes, but the thematic fire layers remain the same.
4. Search for a place
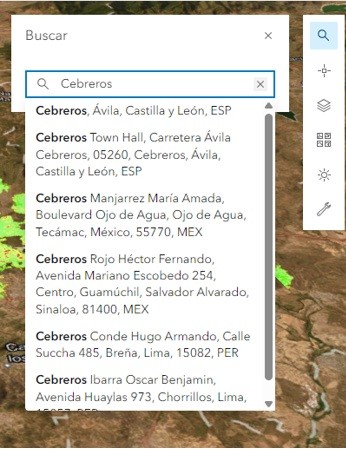
Enter the name of a municipality, an address or a set of coordinates. From that point, you can explore the surrounding area and see how it relates to the affected area.
5. Switch layers on and off
First, look at each layer separately. Then combine two or more. This comparison is the best way to discover relationships between terrain, burn severity and erosion risk.
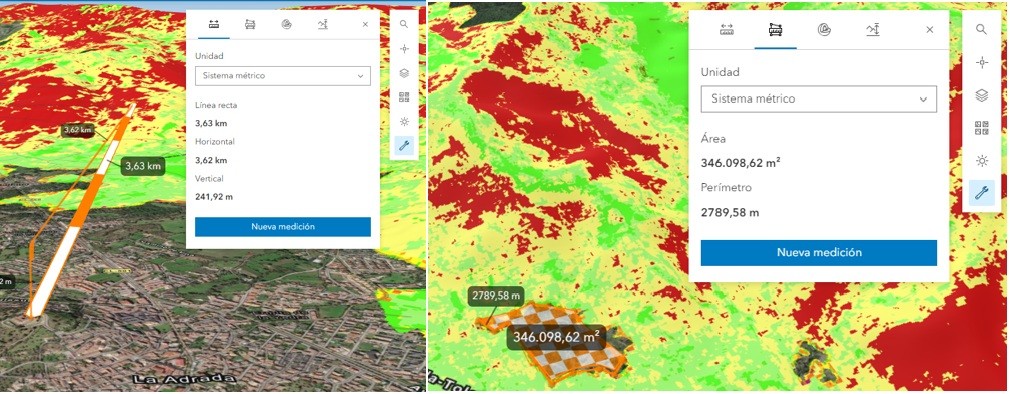
6. Measure distances and areas
Use the measuring tools to obtain approximate measurements. These measurements help you explore and find your bearings, but do not replace an official boundary delineation or a topographical survey.
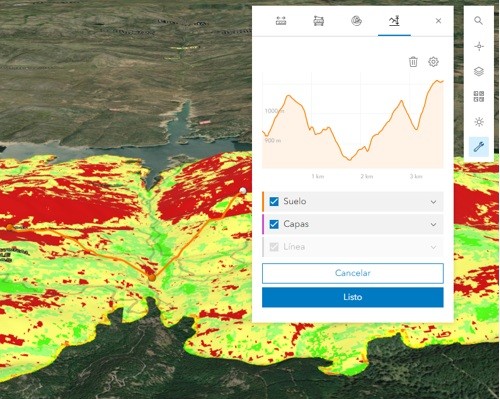
7. Draw a terrain profile
Draw a line across a hillside or valley to see how the elevation changes along it. The profile helps you understand the continuity and gradient of the terrain.
A practical five-minute walkthrough
Try this exercise
1) Search for a place you know. 2) Tilt the view to identify the terrain. 3) Switch on the burn severity layer. 4) Add the erosion risk layer. 5) Find a hillside where a slope coincides with high risk. 6) Ask yourself what additional information would be needed before deciding on an intervention.
This exercise is not intended to provide a diagnosis. It helps you understand how GIS can take you from an overview to specific questions about the landscape.
Questions we can ask
Which settlements, tracks or valleys are close to the perimeter?
Where does the map show the greatest differences in burn severity?
How does the information change when viewed over the terrain?
Which hillsides are shown as having a higher erosion risk?
Which areas would be worth inspecting on the ground with specialists?
Important
The viewer is a tool for public information, exploration and understanding the landscape. Its layers depend on the data and methods used. Decisions about forestry interventions require on-site verification, additional information, permits and specialist technical assessment.
From mapping to recovery
Restoring woodland affected by a major wildfire is not simply about planting trees. It also involves observing natural regeneration, protecting the soil, understanding water and erosion, caring for biodiversity and choosing the right intervention for each location.
Geographical information helps establish a shared understanding of the landscape. It makes technical data more accessible and facilitates dialogue between local residents, landowners, municipalities, specialists and public authorities.
Explore, compare and ask questions. Understanding the landscape better is the first step towards caring for it and making informed decisions about its recovery.
Open ALBIETAR's interactive 3D map
ALBIÉTAR — For our woodlands, our villages and our future.
Sé el primero en comentar
Cargando comentarios…